Infographics are the rage today, like Disco in the 70s or EDM will be when we’re looking back in 20 years. There’s something so very compelling about graphs, charts, and bright colors that are telling us something useful. It’s not a big surprise, then, that you want to create an infographic. This may seem easy, but it actually takes a good deal of self-conducted research or thoroughly sourced statistics to make an excellent infographic. I’ll assume you’ve already done this.
I’ll assume you’ve got the next-best infographic in the entire world and it’s ready to share, because that’s the step you should be at when reading this article. Does a falling tree make a sound if nobody is there to hear it? Does an infographic contain important data if nobody reads it? I’d venture a “yes” in both cases, but you probably want somebody to read your infographic. If not to be floored by your stunning presentation of life-changing information, then at least to drive traffic to your website. I’ve meandered my way to the point of this whole thing: exposure. Creating an infographic is great, especially if you’re the conductor of the research in the infographic. This can provide a huge boost to your website or business if shared effectively.
Below are 33 ways to get your infographic published on more sites:
Press Releases
When NASA discovers a new earth-like planet it releases a press statement. It’s official, easily shareable, and contains all the necessary data for experts and laymen alike to understand what’s going on. A press release for your infographic is the most professional way to handle the dissemination of your new-found knowledge. You’ll want to craft well-written paragraphs around your infographic to make this press release seem complete. These are effective ways to increase exposure because not only do they email a long list of online publishers for you, but they help you to get your SEO working at optimal performance. They’ll also cost some serious dollars.
1. PR Web
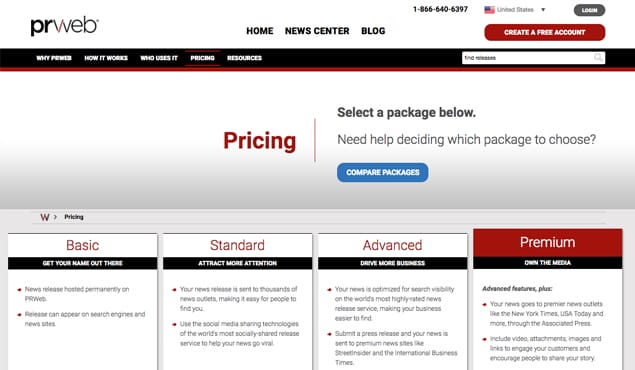
PR Web is one such firm. It will send out an official press release for as little as $99, putting your infographic in the inboxes of countless news sites. It will also put a permanent link on its own website, so you’re sure to get one solid backlink and source for your infographic.
The same sort of service, iReach will distribute your content to hundreds of websites, make integration with social media easy, and is linked up with Yahoo. Plans start at a $129 for a single press release, but for $299 you’ll get the most access, including access to 1,400 sites and engagement tools.
3. PRLeap
PRLeap, like the previous two, is a paid service that will help you create an impeccable press release and drop it in the hands of major publications. Unlike the previous two, you pay a yearly cost for a number of press releases. The most inexpensive plan is $395 per year for 4 press releases. If you’ve got the money for that kind of exposure, these will skyrocket your infographics into the mainstream media.
Social Media
The previous three examples were paid, high-end services that, when used, will give your infographic a serious boost. If tons of cash is not an option (it’s usually not), there are a number of other very effective strategies. The first is social media.
I know that’s broad. Each step below will break down different social networks, strategies within networks, and speciality programs to make your infographic get noticed, and published, on more sites.
4. Reddit
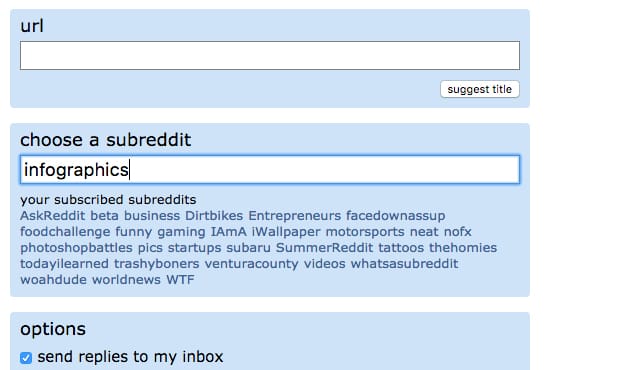
Reddit is all about community engagement and participation. For the uninitiated it can seem daunting, but at its core the service is just a place for people to post interesting things they find online. If the content is interesting enough, other people will “upvote” it, which makes it rise higher in the trending category, which means more people will see it, and upvote it, and on and on. The simplest method for increasing exposure of your infographic is to post the link and the image onto Reddit. Either post in the /r/infographics subreddit, or in the subreddit that is most closely linked with your topic. It’s a good idea to post in multiple subreddits. Reddit is also fairly swift-moving, so you can post multiple times over a few weeks.
5. Post Frequently on Twitter
Ah, Twitter. This in and of itself is a huge topic, one that I can’t fully describe in a numbered list, so I’ve broken it down into a few smaller points. First and foremost, post frequently on Twitter. If you have an infographic, include the image, the link back to your website, and an embed code in your tweet. Use characters wisely, but remember that the whole point is to Tweet out multiple times a day, every day. You can use different hashtags and tag different people each time, creating some cross buzz for your infographic just by posting to Twitter.
6. Direct Message on Twitter
Another way to use Twitter is to search the social site for infographic-loving accounts or accounts that are interested in your infographic’s topic. Direct message them (not more than once) with a blurb about your infographic and a link. Mention that you’re doing a PR blast on a variety of channels, and would love the support. You won’t get responses from everyone, but if you’ve done a good job selecting the right people, you will be bound to get shares. You can search on Twitter itself, or use a software program to help you analyze potential matches.
7. Pinterest
Another beast of a social network, Pinterest is a dominant force in the visual sphere when it comes to online audiences. Infographics thrive here, and therefore you should be posting your infographic to Pinterest with aplomb. Use tags, keywords, and other user’s collections to boost your visibility, including sending messages to users. In your original pin make sure to include a link back to your website, or the authorship of your infographic could get lost in the shuffle.
8. Tumblr
Tumblr is the second-largest image-based community, and functions more as a blogroll for many people. If you get your infographic rolling on Tumblr it can get posted hundreds or thousands of times in a day.
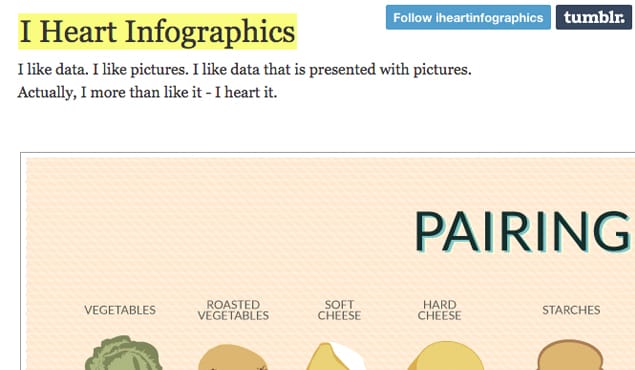
The content has to be good, but it doesn’t have to take much more than that. Like all the other networks, seek out Tumblr accounts that accept specific infographic submissions, like I Love Charts. Also find Tumblrs specific to your infographic content, and email them directly with a link. This might sound repetitive, I know, but it really works. If you take the time to reach out to individual people that have a connected cause, you’ll be bound to get more links back to your own website, and more websites that post your infographic.
9. Personal Facebook
It may go without saying, but Facebook is absolutely vital to the life of a healthy infographic. Even if you created your infographic for a business, be sure to share it on your personal account. This means your friends will see it, and typically your friends have similar interests as you do. If not, they will support you unconditionally (I would, as a friend, anyway). Often times people forget the power of a personal account, and if you ask your friends to share something, it greatly increases the reach factor.
10. Business Facebook
Like the above example, you should obviously be sharing your infographic on your business Facebook Page. Try to post it with a question or fact that engages users to comment and respond, because this will increase shares overall. The best way to get an infographic on multiple websites is to get it trending, and the best way to get it trending is through Facebook blow-ups. If you see your infographic picking up steam with comments and shares, make sure to answer comments, provide more salient links for your sources, and educate those interested. That’s why you made the infographic in the first place, right?
11. Paid Ads on Facebook
If you’re having trouble doing the above organically, consider paid ads on Facebook. It sucks to pay for something that could also be achieved “free,” but you have to consider the time it takes to make something viral on your own. If time is money, then how much money are you spending by boosting the traffic without ads?This is especially effective if your infographic is doing well but not exceedingly well. A paid ad — even $10 — can effectively boost that infographic to the point where random people start sharing it. You want to get the ball rolling, and Facebook ads will give it a good hard push.
12. StumbleUpon
StumbleUpon is not really a social network, but I’ll put it here because it acts a lot like one.
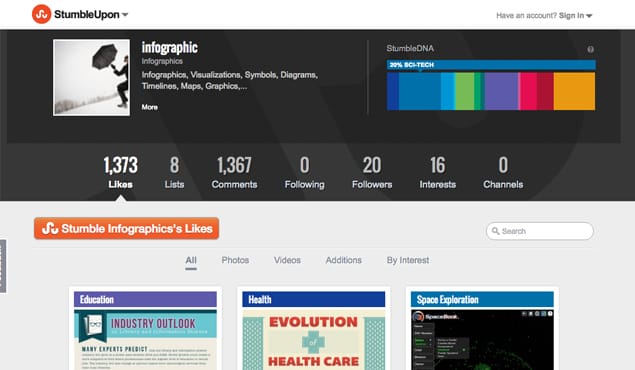
This is very simple, actually. Just upload your infographic to StumbleUpon, tag it correctly, and wait. Over time people will Stumble on your image and, because the content is great (right?), they will like it and share it.
StumbleUpon is one of the biggest sources of random hits to websites. While it doesn’t always breed the most loyal of followers, it can amass a large number of views very easily.
13. Flickr
Flickr is the last bastion of social media resources, and again, it’s not quite social media. Owned by Yahoo, Flickr has become the one-stop-shop for all images uploaded by users. Businesses upload tons of images too, which is where your infographic comes in. The simple version is to upload your infographic to Flickr, include a link back to your website, and appropriately tag it so people will find it organically. Neil Patel suggests breaking the infographic down into individual screen shots, each with a certain point or statistic, and publishing each of these as well. This effectively creates a whole album based on your infographic, which will increase the likelihood of people finding it.
14. Drip Campaigns
Twitter and Facebook are necessary platforms for sharing your infographic, but there’s a specific way to share them that’s important, too. This mentality can really be applied to any social network, as long as it doesn’t overload your followers and piss people off.
A drip campaign is when you extend the life of a piece of content, like an infographic, by turning into multiple posts. This is most effective on Twitter, where you could post upwards of 10 times a day and not upset anyone.
For an infographic, do this by posting a screenshot of part of the infographic and a fact, or just a fact, and linking back to your original website with the infographic. Depending on the depth of your infographic, you could potentially have 10-30 posts that hover around the same topic, all link back to your original content, and continually engage users. You can do this to build up a launch mentality for the infographic, or after the full infographic is out. Either way, you’re creating buzz.
Tailoring the Original Infographic
While the above methods work splendidly if done correctly, you’ll also want to make sure your infographic is properly formatted and sharable so that when people do come back to your site, they can send it out to the world easily.
15. Make it embeddable
The key to an infographic is how easy it is to share.
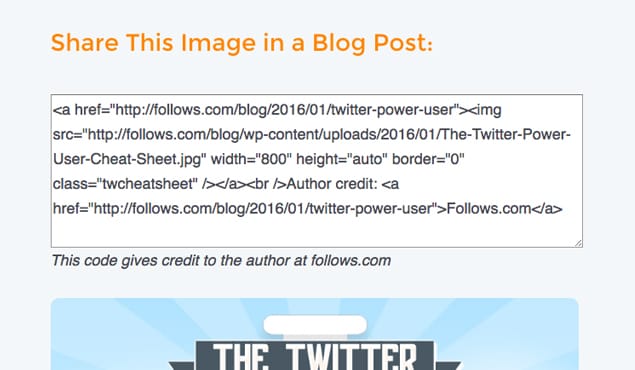
The first step for this is making it easily embeddable. QuickSprout has a great video tutorial on this process. In short, it makes the reposting of your infographic on other websites a copy/paste away, which cuts out most of the work.
16. Add Social Buttons
This could have gone in the above category, but I put it here because it’s really about tweaking your own website. You should already do this, but make sure your infographic can be shared with a single click on any of the above social networks.
There are a number of ways to do this depending on what platform you use for your website, but the crux of the matter is that the image itself should be sharable, in addition to the post. When you scroll over the image of the infographic buttons should pop up so that a reader can quickly share it on their social network of choice. Likewise, a reader should be able to share the entire post you made, which will include your intro, a link to the website, and the infographic.
17. Be Specific About Citations
Part of creating the embed for your infographic is making sure that when people do decide to post it on their site, it links back to you. This will be included in your embed code, but sometimes people just grab the image and share it. You want to be clear with potential readers that you are more than happy for them to take the infographic and share it as much as possible, and that you require a link back to your website. You can write this out in plain text below the infographic, include it in the Alt Image tags of the image, and put another disclaimer on the post somewhere so that at least users are aware you want it properly attributed. This will go a long way in getting you valuable backlinks.
Proper Sources
If you want your infographic shared on reputable websites, this is probably the most important step. There are two main categories when it comes to creating a respectable infographic: doing your own research, and citing legitimate research.
18. Do Your Own Research
If you’re going to do your own research, it needs be thoroughly conducted and cited. This is not easy for small organizations depending on the type of infographic you’re making. If you do conduct your own research and use it in an infographic, you’ll also have to produce some sort of white paper or study that you can link out to. We’re in the technology and information age, but that doesn’t mean all information is accurate (just like all technology might not work). If you create an infographic with your own research, but that research isn’t peer reviewed or accessible to readers, you won’t get your infographic featured on many legitimate websites.
19. Citing Other Sources
This is the more practiced method of infographic creation. Organizations like Pew Research Center conduct countless annual surveys, the data of which is usually accessible to the public and organizations for use in reports and infographics.
If your infographic is based on other people’s research, you have to cite it. Either cite it in the infographic itself with a URL link at the bottom, or include it in the press release for your infographic. If you create a compelling infographic off another organization’s data and cite your sources, you will rank high on other websites.
20. Contact those original sources
The last step in this process is, if you’ve used other organization’s studies to create an infographic, contact them directly. Tell them you’ve used a specific study (include a link), compared it with other studies (include those links), and created an infographic that sheds new light on a subject. Not only with this create a direct link between you and your source material, but that organization will likely want to help you promote the infographic. This is beneficial for them because their research was used, so they’ll be happy to promote it. If that happens for an organization like Pew, who has thousands of readers, you’ll get your infographic seen by many people.
Infographic Directories
The above methods engage a variety of resources at your disposal to increase the chance of your infographic being shared, going viral, and getting posted to other websites. They will all work, but there’s one last major resource you can use. Below are 13 infographic directories you can check out and submit your infographic to. Most of them are sites specifically built around hosting excellent infographics, so you just need to submit your infographic according to their instructions and wait to see if they feature you. Many (but not all) of these were sourced from PiktoChart.
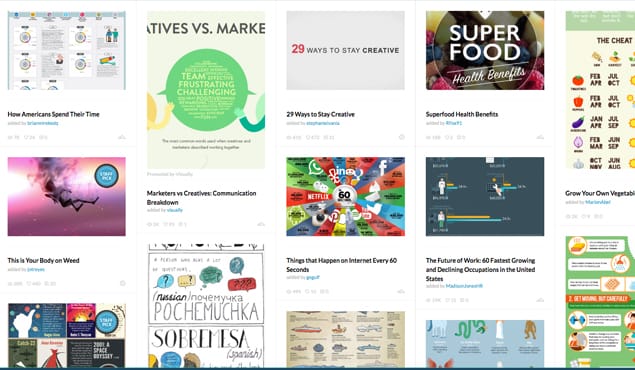
21. Visual.ly
The most well-known infographic repository on the web. Visual.ly actually creates infographics for clients, but it still has a highly trafficked community submission aspect. Just log in and submit an infographic.
Just like the name implies, this site shares an infographic a day, every day. They receive submissions from anyone and get tons of views. Have at it.
Cool Infographics is a lesser known, but highly respected infographics website. The infographics range in information and style, but all of them are pretty fascinating. It doesn’t publish infographics itself, but shares them, so you want to send your published infographic to them.
24. NerdGraph
Your standard infographic website. NerdGraph accepts submissions from everyone and hosts the infographics on their site.
Another standard infographic website with a decent amount of views. Submit away.
Infographic Journal is yet another submission based website. They focus on “quality over quantity” — but I’m willing to bet everyone else does too. This project is by the founders of SearchRank, so they know what they’re doing. Submit at your leisure.
27. Infographics Showcase
Yet another infographic site! Submit, submit, submit! They are accepting paid submissions, so if you want to pay your way, go for it.
28. VisualLoop
VisualLoop is a comprehensive infographic site that is selective in its curation and features designers. The site is partnered with infogr.am, am infographics creation tool, in case you want help with that, too. You can submit through the standard contact form.
This site is interesting in that it actually reviews infographics. The reviews are thorough and can be harsh, but if they like your infographic it can go a long way. Even if they don’t like your infographic you’ll get a couple backlinks from a review. Contact Infographic Reviews if you dare.
30. Love Infographics
Love Infographics has a nice name, and good vibes. You can submit infographics for free, but you’ll have to create a username with them. It also focuses on promoting the infographics with social media, so will boost your views in that way.
31. Infographaholic
Infaographaholic likes to accept lots of infographics. You have to meet the guidelines, but beyond that you can get on the site for free, which will give you a permalink. You can also pay to get a hyperlink and social media promotion, so this is clearly a business model.
32. Infosthetics
This site is all about data visualization. I know infographics visualize data, but Infosthetics really cares about unique and strange data-filled infographics. Think lots of spiraling designs and complicated numbers. You can email them with your infographic if fits the vibe of the site.
Yes, Mashable is a normal news mill. That’s a good thing and a bad thing, because it means tons of traffic, but it also means lots of competition. Mashable has a respectable infographics section that gets tons of hits, so consider submitting your infographic to the site for review.
In Summary
You’ve got 33 ways to get your infographics out there. Remember: great content, persistence, and a huge variety of sources will get your infographic online.
 ContentPowered.com

